Well I have always loved the Heavens but especially the Sun. That little bright ball up there is the only reason we exist. No Sun No WE! Now its been heating us up for a long time. Just like a fine watch it keeps going and going. Now even the Sun gets run down at times and cools just a little. We are 93,000,000 miles away from the Sun and it still warms our planet. Oh by the way any closer and we FRY and any farther we FREEZE. Just thought I would throw that in.
I want you to think of the Sun as pot of hot water on the stove. Now you can bring water to a boil and it roils like crazy. Really hot water. Now if you get it to a temp close to boiling, it is still very hot just not boiling hot. The Sun is the same. When the Sun is very hot it boils like that water making bubbles on the surface. These are the Sunspots. The more Sunspots the hotter the Sun is. Fewer Sunspots means its still hot but much cooler than when there are many Sunspots. Now for all you skeptics check out there this chart at : http://solarscience.msfc.nasa.gov/greenwch/spot_num.txt It covers Sunspot activity since 1749 starting in the month of May of that year.
Below is the 1913 records of Sunspot activity from that site. The numbers in ( ) is the number of sunspots seen in a given MONTH per DAY. I put the () around them to make them easy to read.
JAN 1913 1 (2.3) 3.6 FEB 1913 2 (2.9) 4.5 MAR 1913 3 (0.5) 1.7 APR 1913 4 (0.9) 2.9 MAY 1913 5 (0.0) 0.0 JUN 1913 6 (0.0) 0.0 JUL 1913 7 (1.7) 3.7 AUG 1913 8 (0.2) 1.3 SEPT 1913 9 (1.2) 3.6
OCT 1913 10 (3.1) 4.6 NOV 1913 11 (0.7) 2.2 DEC1913 12 (3.8) 6.8
I can hear it now why pick 1913? Well as I have posted earlier it has snowed quite a bit here in the last few days. It snowed 26.5 inches in 3 days. My point is that this 26.5 inches of snow snapped a 96 year old record for snow in April. April 1913 to be precise. We beat it by 8". Now that's a record that has stood for 96 years. The Sunspot activity in April 1913 was 0.9 sunspots per day. There were no Sunspots on the 25th through the 29th of April 2009. It snowed 26.5 inches it that time frame. If you doubt it go to, http://www.swpc.noaa.gov/ftpmenu/forecasts/SRS.html and see for yourself.
Now in 1913 there were no Sunspots again until July of that year.
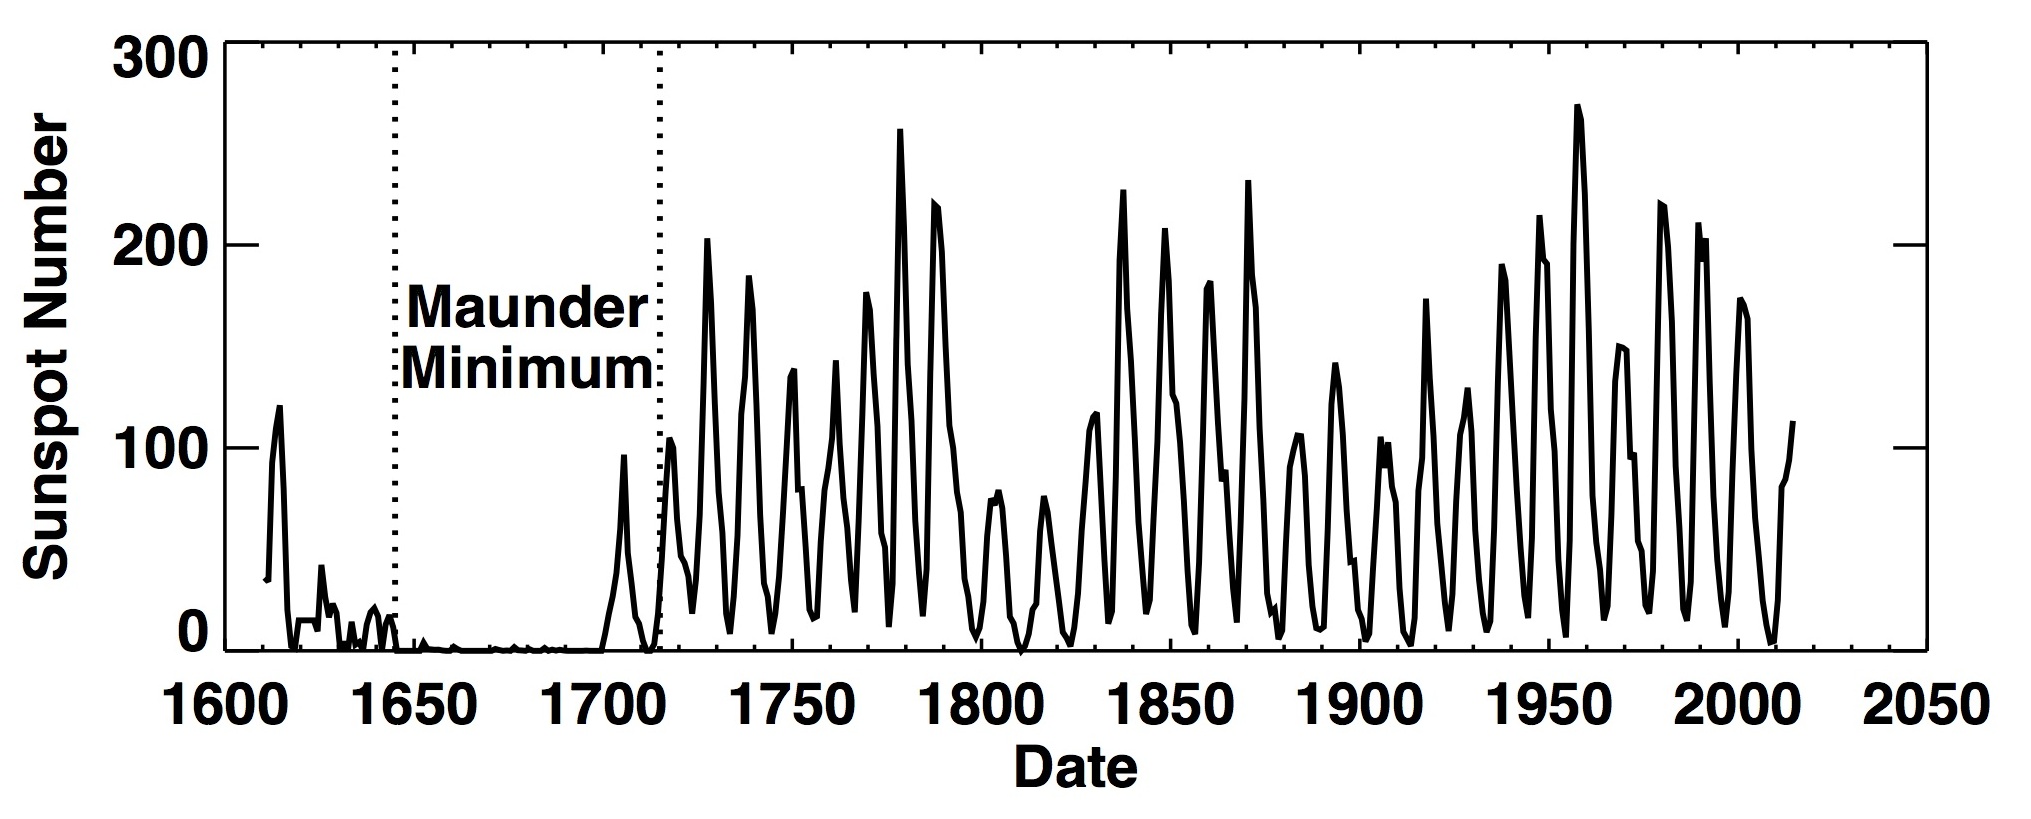
Now to go back even farther in time to 1645 through 1715. This is the lowest recorded period of Sunspot activity EVER! The data for this period is located at the site below.
http://solarscience.msfc.nasa.gov/SunspotCycle.shtml : This is called "THE MAUNDER MINIMUM"
Early records of sunspots indicate that the Sun went through a period of inactivity in the late 17th century. Very few sunspots were seen on the Sun from about 1645 to 1715 (38 kb JPEG image). Although the observations were not as extensive as in later years, the Sun was in fact well observed during this time and this lack of sunspots is well documented. This period of solar inactivity also corresponds to a climatic period called the "Little Ice Age" when rivers that are normally ice-free froze and snow fields remained year-round at lower altitudes. There is evidence that the Sun has had similar periods of inactivity in the more distant past. The connection between solar activity and terrestrial climate is an area of on-going research.
I guess historical records are not good enough! But anyway I digress.
Now lets recap, Maunder Minimum Less Sunspots colder earth, Maunder Maximum More Sunspots Hotter Earth. Got It!
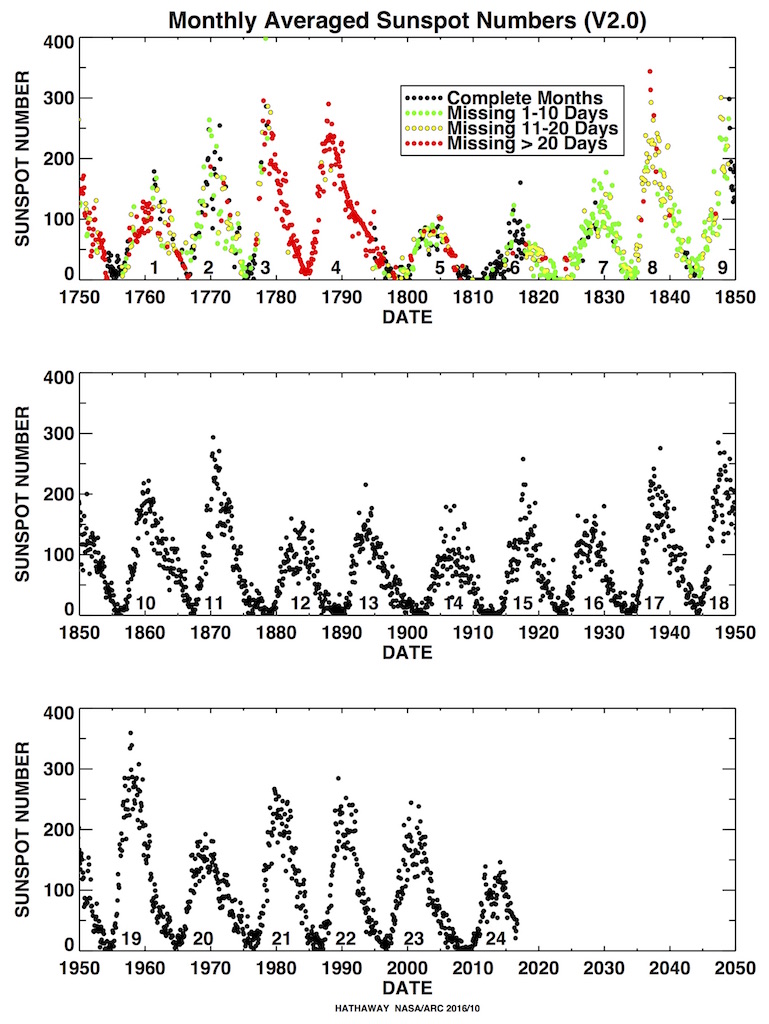
We are now in Maunder Minimum as I type and have been for quite a while. Since 2007 to be precise. Check out the charted data here : http://solarscience.msfc.nasa.gov/images/Zurich_Color_Small.jpg
The Earth is starting to cool in conjunction with the Suns 11 year cycle of Sunspot activity. We are now at the lowest point of Sunspot activity in this part of the cycle.
Now my whole point of this is to put my 2 cents into the GLOBAL WARMING THEORY. If you look at the charts and then check out the weather during any given year back to 1749 you will see that its colder on Earth in the years that fewer sunspots are recorded. Just the same it is HOTTER on Earth when there are more Sunspots!
Now the hottest period we have had on Earth is from 1998 to 2007. There were groups of sunspots during that time frame. Check it out.
So one more time repeat after me: MORE HEAT HOTTER PLANET, LESS HEAT COLDER PLANET! Period.
If your read this rant Thank You. I hope you at least give this some thought. It would be nice if we started worrying about important things, not what the temperature of the planet is since we can do NOTHING about it!
Mark, up to his butt in 26.5 inches of snow in APRIL!


Mark, you gotta get with the *program*...It is not called "Global warming" anymore... It is called "Climate change" or "Climate churn". That way our rulers can still claim that man is screwing up the environment, regardless of which phase of the solar flare cycle we are in.
ReplyDeleteIt's a wonderful day in the neighborhood,
a wonderful day in the ...